A Database You Can See
💡Typhon is an embedded, persistent, ACID database engine written in .NET that speaks the native language of game servers and real-time simulations: entities, components, and systems.
It delivers full transactional safety with MVCC snapshot isolation at sub-microsecond latency, powered by cache-line-aware storage, zero-copy access, and configurable durability.
Series: The Typhon Workbench — the tools that make the engine usable
- A Database You Can See (this post)
- You Can’t Optimize What You Can’t See (coming soon)
- Querying by Hand (coming soon)
A lighter, hands-on companion to the engine deep-dive series, A Database That Thinks Like a Game Engine.
I spent long time making Typhon fast. Sub-microsecond commits, MVCC snapshot isolation, cache-line-aware storage — the kind of numbers that make a systems programmer lean in. Then I opened a .typhon file to debug something, and realized I was staring at a black box. I had built an engine I couldn’t see into.
That’s the quiet trap of infrastructure software: the better the engine, the more invisible it is. A database that does its job disappears — right up until the moment you need to know what your schema actually looks like in memory, which systems touch a component, or whether a query does what you think. At that moment, raw speed is worth nothing without a way to look inside.
So this post starts a new, lighter track in the series — about the Typhon Workbench, the tool that makes the engine usable. The thesis is simple and, I think, under-appreciated:
🎯 Great technology is not enough. You need tools that let people make the most of it.
So, concretely: the Workbench is the tool you keep open to understand a Typhon system — its data, its schema, and its behavior — whether that system is a file on disk, a captured trace, or a live engine you’re attached to. It’s built for both developers and ops. Developers use it to understand structure and chase performance: how an archetype is laid out, what’s actually stored on an entity, where the time goes.
Ops and reliability engineers use it to watch a live system — tick rate, jitter, overload, queue depth — and to freeze the feed or capture a window when something spikes. Either way, it answers what code alone can’t: What does my schema really look like? What’s in this archetype right now? Which systems touch this component? Why did that tick stall? Is the engine healthy? — the things you’d otherwise chase with Console.WriteLine, log scraping, and a lot of guessing. This first post stays on the data-and-schema side; later in the track we reach the profiling and live views.
A quick note on what it’s built from, for the curious: the Workbench is a small full-stack app that runs entirely on your machine. The backend is ASP.NET Core (Kestrel) speaking to the engine; the frontend is React 19 + TypeScript built with Vite, styled with Tailwind CSS and shadcn/ui (Radix primitives), using dockview for the draggable panel layout, Zustand and TanStack Query for state, and cmdk behind the command palette. Nothing leaves localhost.
See it first
Before the words, here’s the two-minute tour:
▶ Watch "Typhon Workbench intro" on YouTube — if the embed doesn't load in your viewer
DataGrip meets a flight recorder
The Workbench is a local developer tool. You point it at a Typhon database — a .typhon file on disk — and it opens a window into everything inside: the schema, the data, and the way both sit in memory and on disk. It can also attach to a live engine or replay a captured trace, but this post is about the simplest, most common case: you have a database file, and you want to understand it.
If you’ve used JetBrains DataGrip, DBeaver, or MongoDB Compass, the shape is familiar — a navigator down one side, an object inspector, a data grid, drill-downs. That’s deliberate. I didn’t want to invent a new mental model for “exploring a database”; the last thirty years of database tooling already converged on one that works, and the Workbench borrows it wholesale. What it adds is the part that’s specific to Typhon: it speaks entities, archetypes, and components natively, and it can show you things a row-store tool never could — cache-line layouts, on-disk fragmentation, the cost of a query before you run it. (The other half of the name — the flight recorder, for profiling a running engine — is a story for a later post in this track. Here we stay with the database.)
There’s no install ceremony — open it, point it at a file, and it’s out of your way in seconds.
From a file to a model you can walk
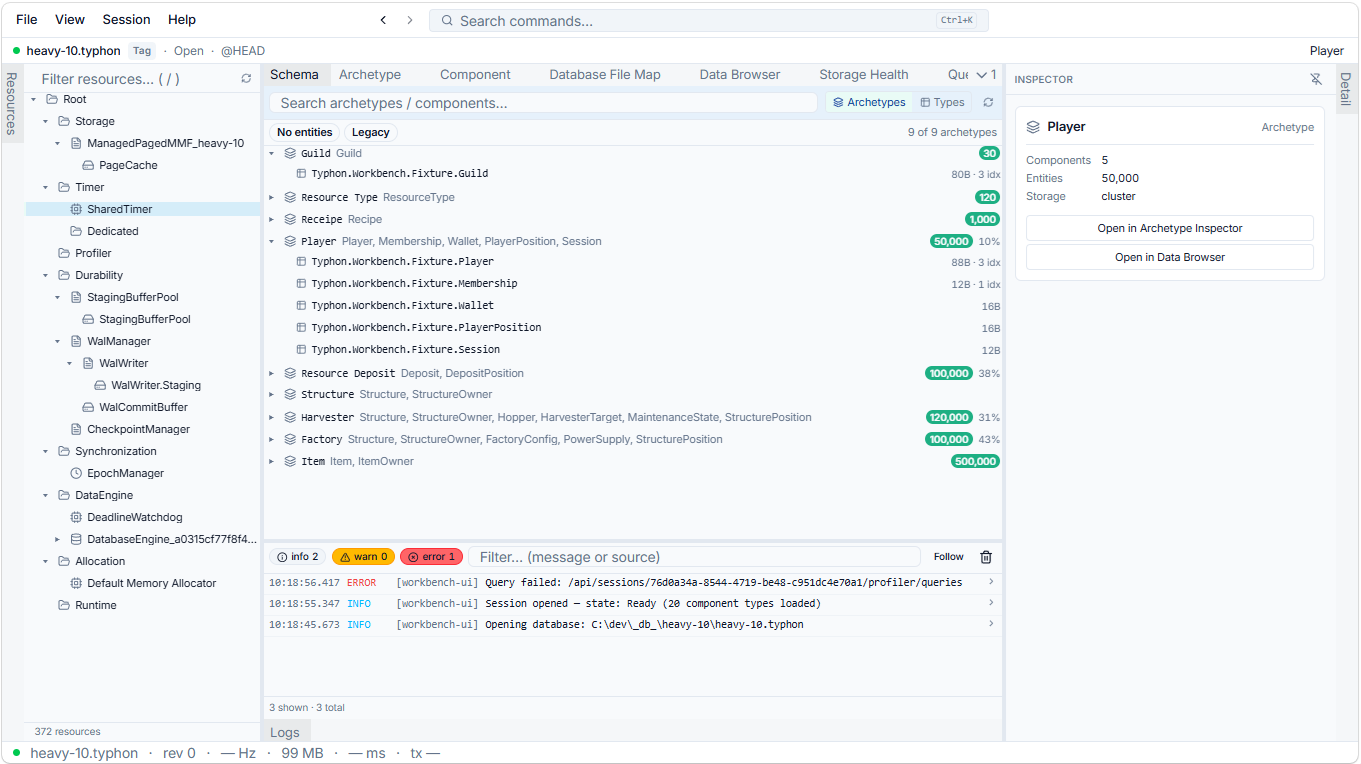
Open a .typhon file and you don’t get a hex dump or a list of opaque page numbers. You get a model you can walk, top to bottom.
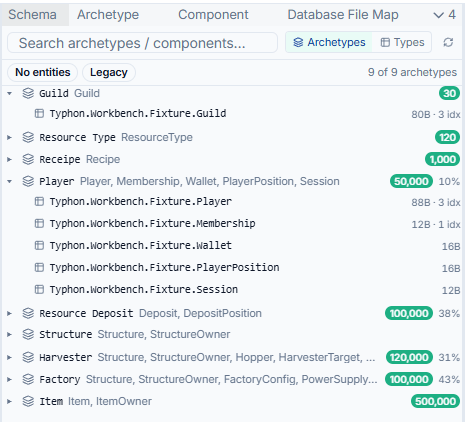
It starts with the Schema Explorer — a tree of your archetypes. As the engine series describes, Typhon stores data the way a game engine does: an archetype is a set of entities that share the same component composition, which makes it the rough equivalent of a table. The Schema Explorer lists them all, with the numbers that matter at a glance — how many entities each holds, which components it carries, how full its storage is. It’s fuzzy-searchable, so on a schema with a hundred archetypes you type three letters and you’re there.
From an archetype you drill into a Component, and this is where it stops looking like a generic table browser and starts looking like something built for this engine. A component isn’t just a column; it has tabs for its fields, the archetypes that use it, the systems that read and write it, its storage mode. (One of those tabs — the memory layout — gets a whole post to itself next time. It earns it.)
Three things from the video are worth calling out, because they’re the difference between a tool you tolerate and one you live in:
- Density is a setting. I stare at this thing all day, so it ships compact by default — more rows, less chrome — but you can loosen it when you’d rather have room to breathe.
- Dark and light both exist and both work. Not a switch bolted on at the end; the whole UI is built on theme variables, so nothing breaks when you flip it.
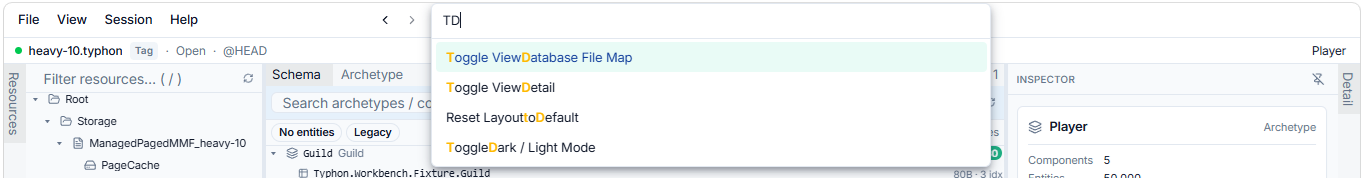
- The command palette is the spine. One shortcut gives you a single search box that reaches everything — every view, and every object in your database. Type a component’s name and jump straight to it; prefix your search to scope it (one prefix runs actions, another finds an object in the current session, another jumps to a moment in a trace). Anything you can reach with the mouse, you can reach from the keyboard. That isn’t a power-user garnish — it’s how discoverability works. Someone who doesn’t know where a feature lives can find it by typing what they want.
One click, every view
Here’s the part that took the most work and is the easiest to miss: in the Workbench, selection is global.
Select a component — anywhere, in any panel — and the whole tool reorients around it. The inspector shows its details. The archetypes that use it light up. The systems that read it and the systems that write it appear together, so you can see the blast radius of a change before you make it: if I touch this field, here’s everything that cares. You made one gesture; several panels answered.
That sounds obvious until you remember how it usually goes. In most toolchains every view is an island. You find an ID in one window, copy it, paste it into another, lose your place, open a third. The friction is so normal you stop noticing it — you just accept that “investigating” means juggling. The Workbench’s bet is that you shouldn’t have to: one selection, shared across every panel, reversible with a back button that always takes you home.
The honest part: none of the individual panels were the hard problem. Most of them existed already. The hard problem was the wiring — a single shared notion of “what is selected” that every panel both listens to and can drive. That’s the unglamorous work that turns a folder full of capable views into something that feels like one product. It’s invisible when it works, which is exactly why it’s worth pointing at.

Real data, decoded
Schema is half the story. The other half is what’s actually in there.
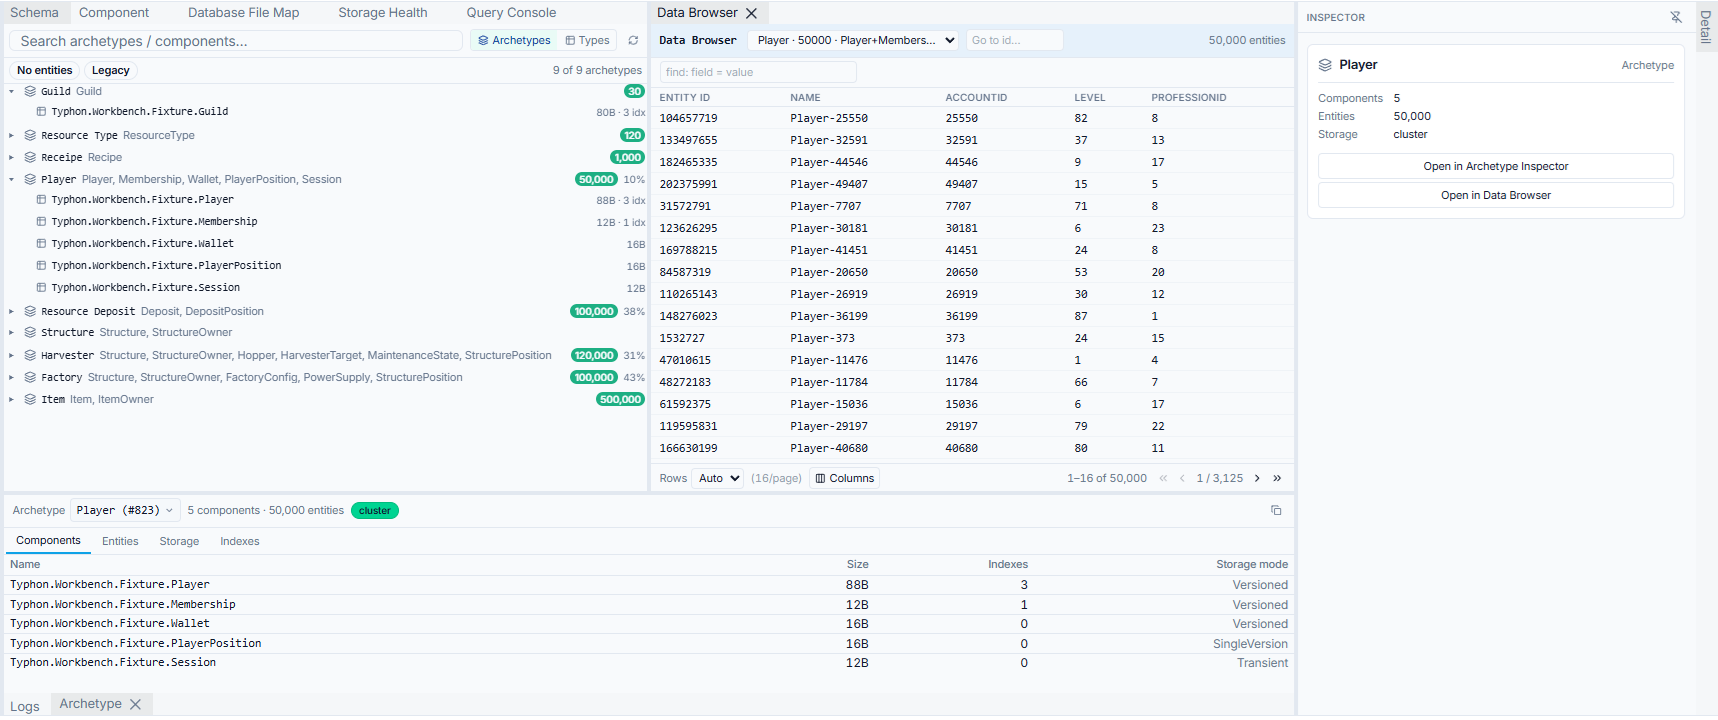
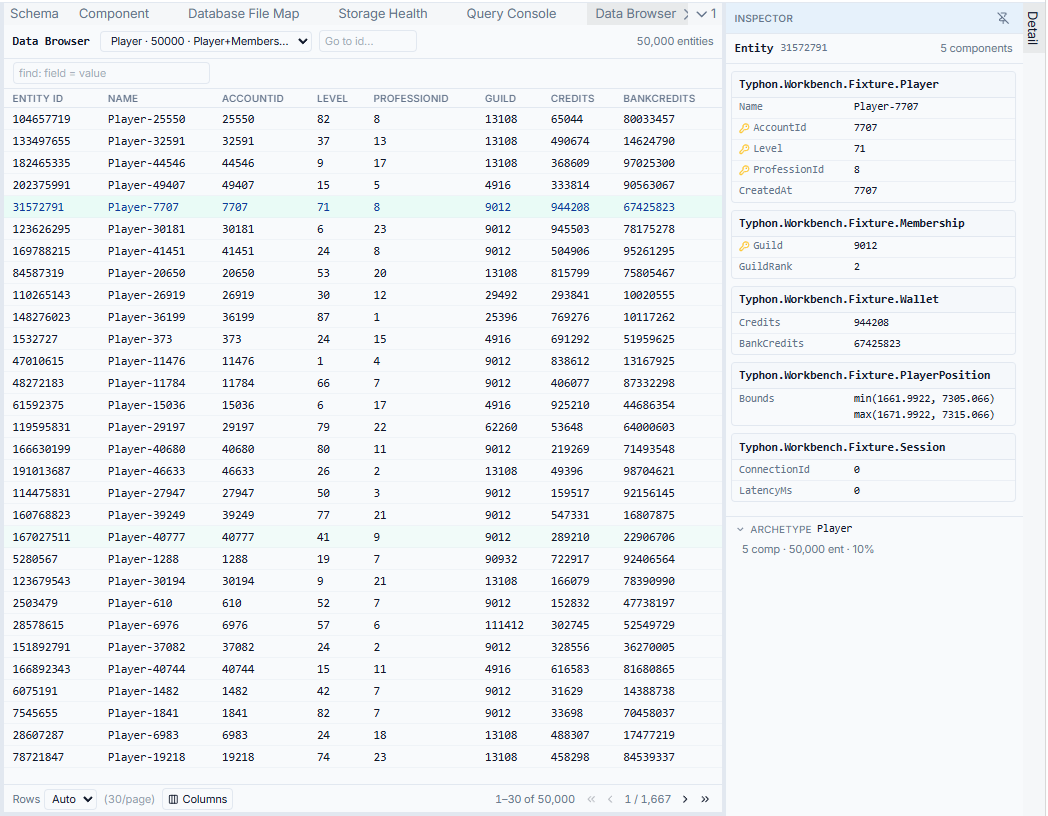
The Data Browser pages through the real entities in an archetype and shows their component values decoded — not raw bytes, not a blob you have to interpret, but Position { X = 124.5, Y = 88.1 }, Health = 98, the actual values your systems are reading. Pick the columns you care about, page through, click a single entity to inspect it on its own. And it’s strictly read-only: looking never changes what’s there, so you can explore a production capture without a second thought.
It closes the loop the rest of the tool sets up. You walked the schema from archetype to component; now you see the data sitting in that shape. From a row you can select a component value and — because selection is global — bounce straight back to the schema side to ask “wait, how is this field actually laid out?” The investigation flows in both directions, which is the whole point.
The lesson: tools need design too
Let me end on the thing this whole post is really about.
Typhon’s engine solved a genuinely hard problem: ACID transactions at microsecond latency, on a data model borrowed from game engines, with none of the usual compromises. That took two years and most of my stubbornness. But an engine is a capability, not an experience. The moment a real developer sits down — to debug a schema, to understand why something is slow, to check what’s actually in the database — that capability is only as good as their ability to reach it.
The Workbench is the other half of that work, and it needed its own kind of design discipline — none of it about raw performance:
- One action, not three. Any move you’d want to make is a single gesture from where you already are.
- No dead buttons. A control that renders is a control that works. Nothing that looks clickable does nothing — broken affordances erode trust faster than missing features ever do.
- Selection is global and reversible. One click drives everything; the back button always brings you home.
- Speed without orientation is just a faster way to get lost. Fast and oriented, or it doesn’t count.
That’s the under-appreciated half of building good technology: the tools aren’t a cherry on top, they’re the path the value travels to reach a human being. You can have the fastest engine in the world, and if nobody can see inside it, you’ve built a very elegant black box. I’d rather build one you can see.
What’s next
Next in the Workbench track: You Can’t Optimize What You Can’t See — where the abstract gets physical. The component layout grid shows you cache lines, field padding, and alignment as something you can actually look at; the File Map draws your entire database on disk, fragmentation and all. Meanwhile the engine track continues its deep dives.
Follow the GitHub repo for source and benchmarks, or subscribe via RSS.